Visualog
An experiment at visualizing a year-long journey using Google Maps, with data from Moves & Instagram.
Travel curiosity
While traveling around cities, where do I spend my time, and how do I get to where I’m going? What movement patterns could be seen from a year’s worth of journey?
Movement tracking
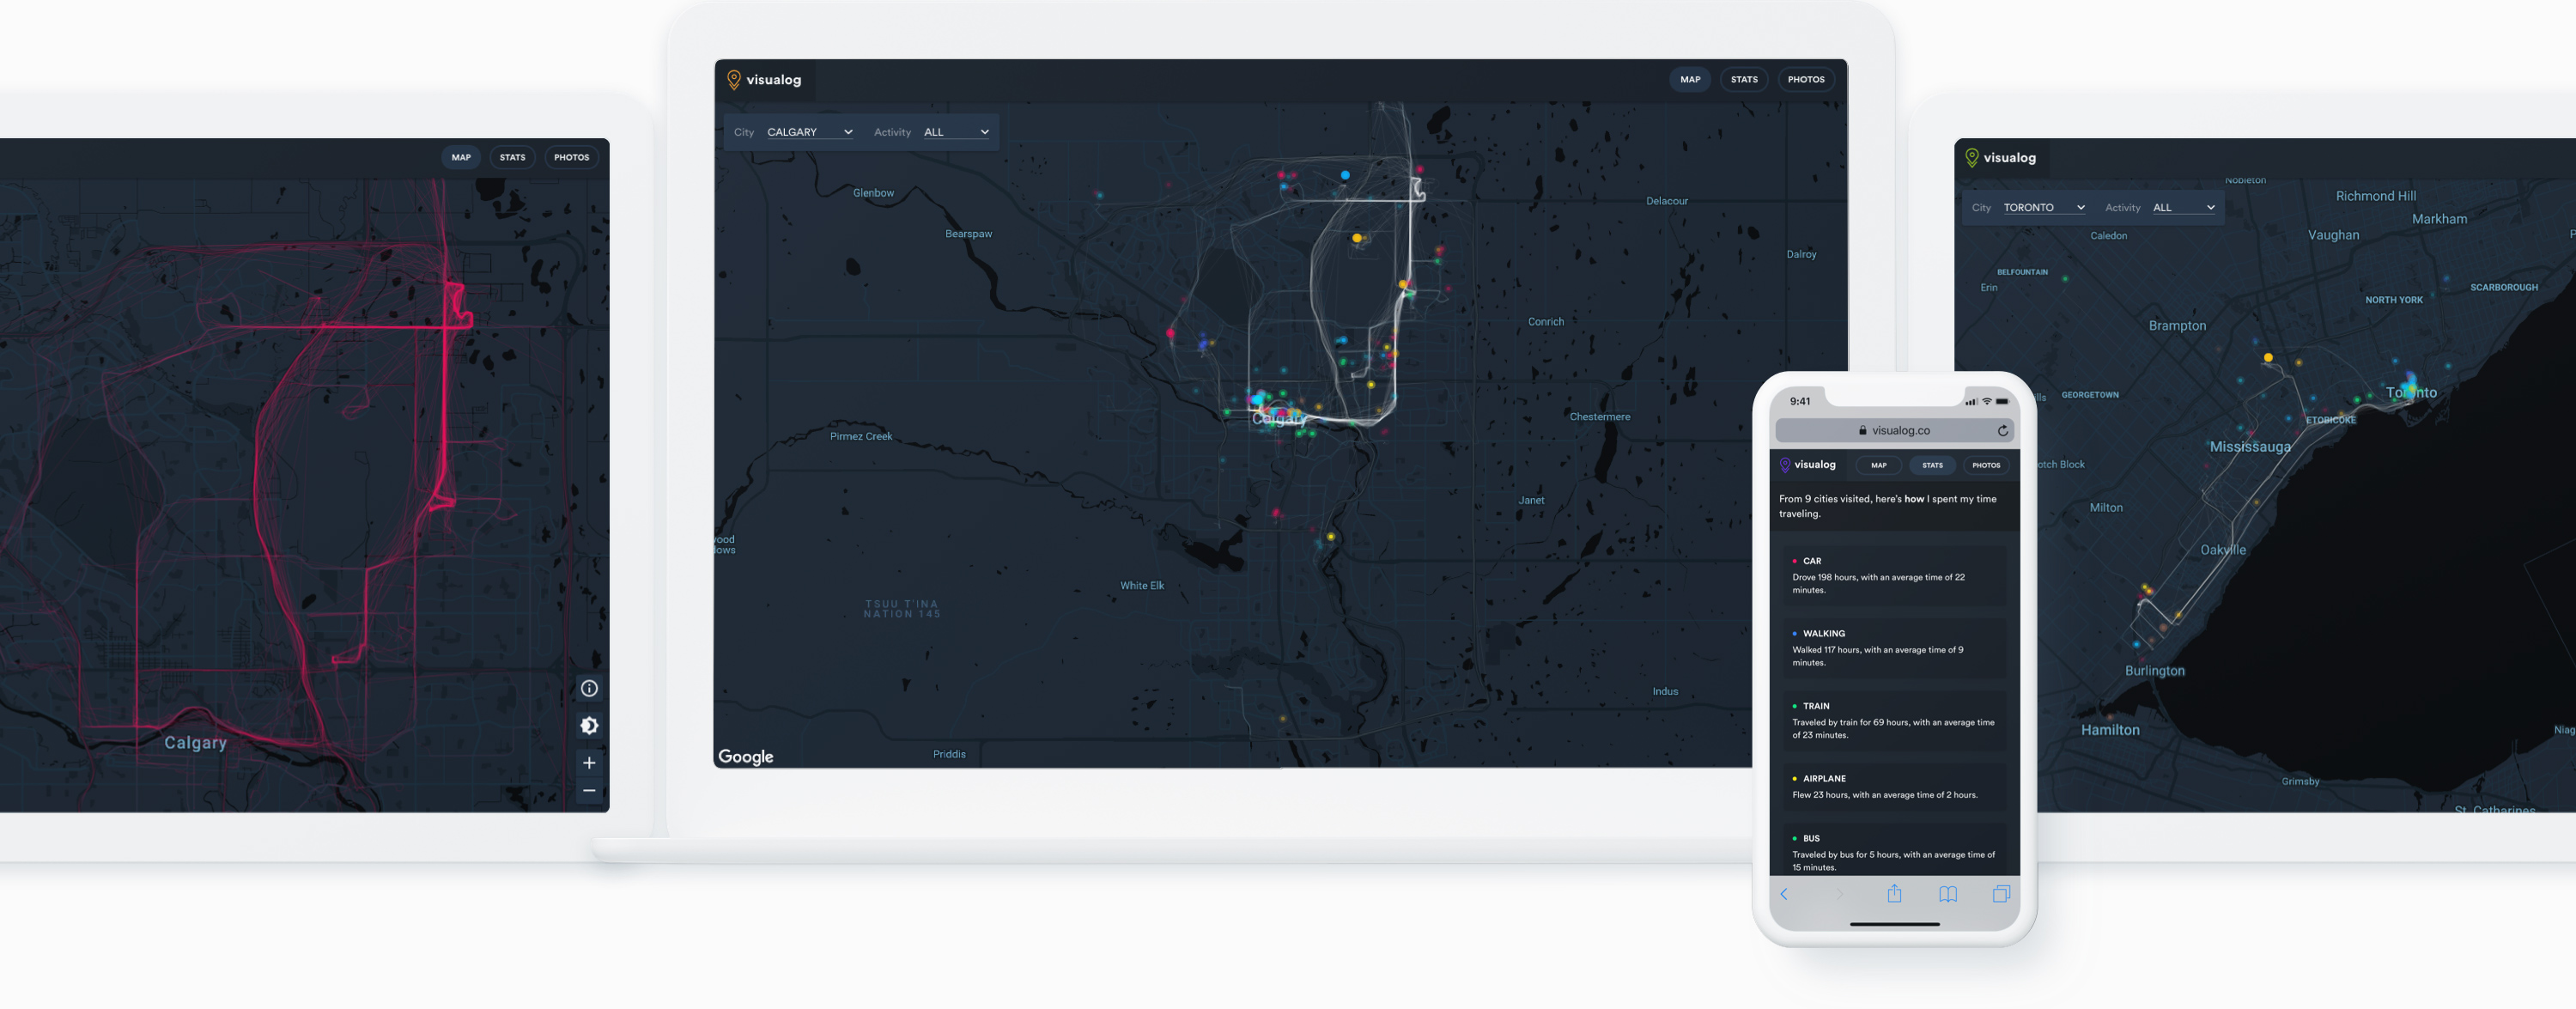
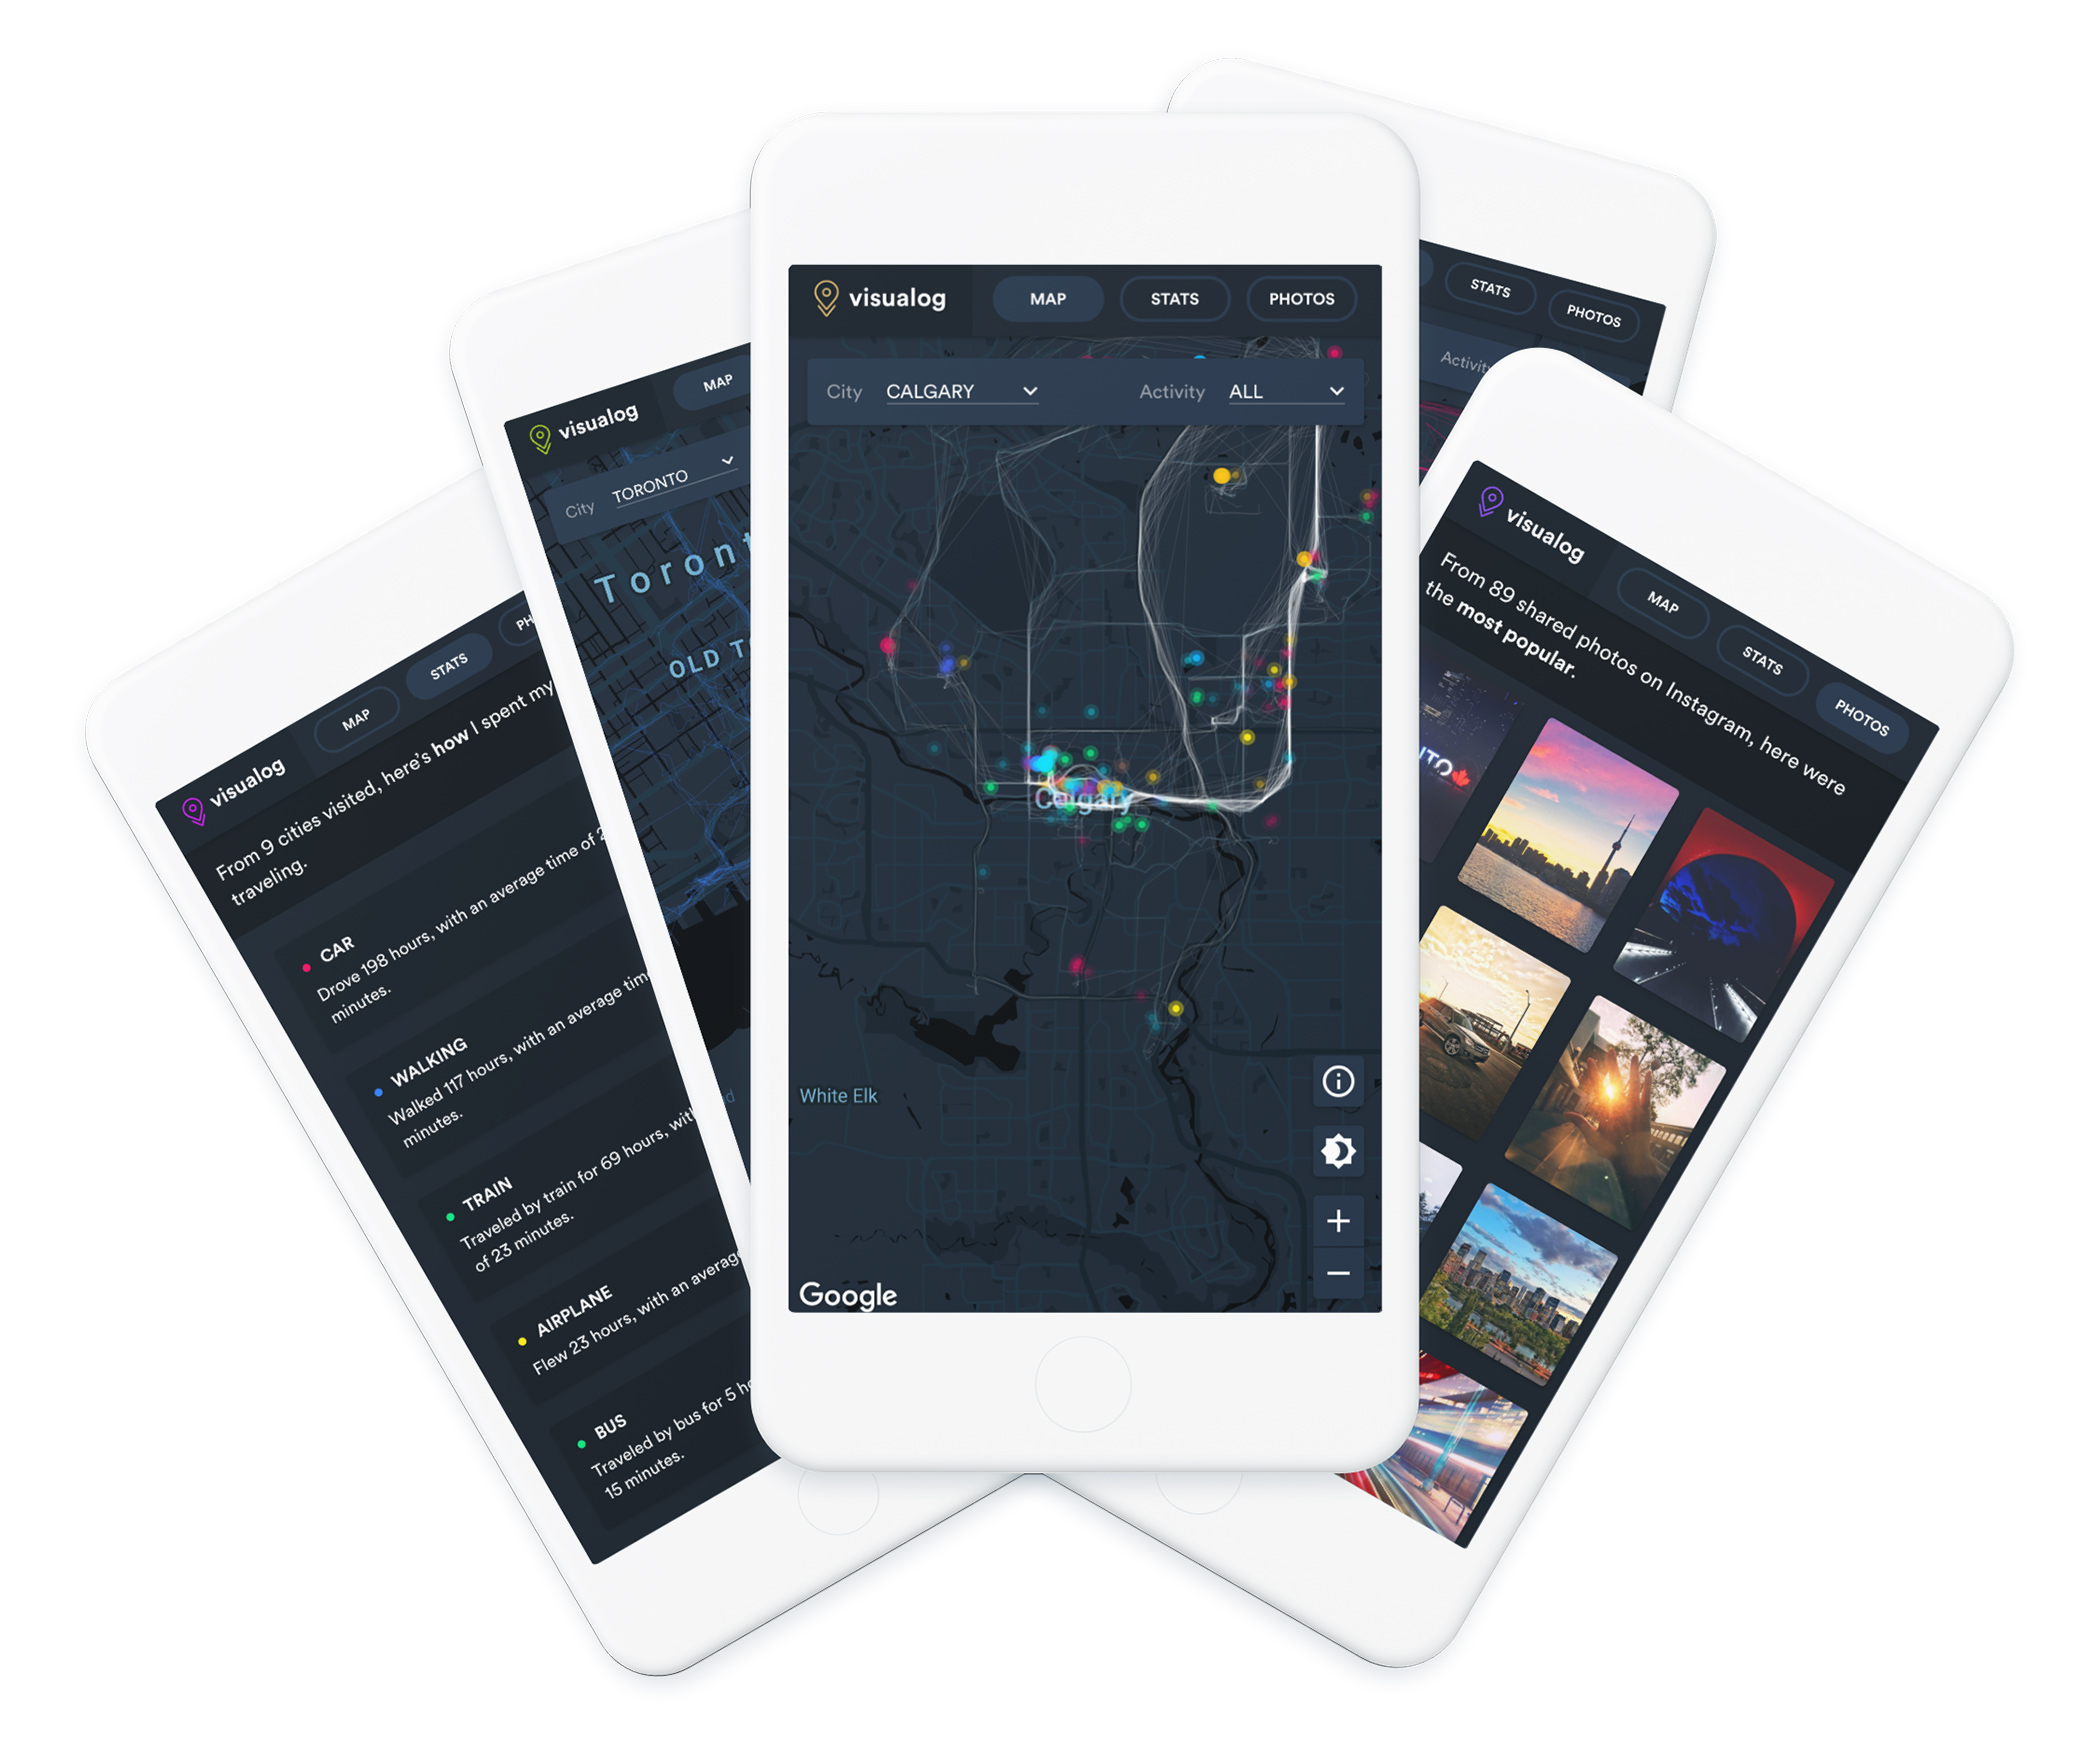
Track my location using Moves app to assemble a year-long dataset of different movements and places visited for understanding where and how I travel around cities.
Process
Since location plays an important role in determining my curiosity, the UI of the web app had to be map-centric. Furthermore, it needed to have strong contrast between the map (background) and data layers (foreground). At the end of 2017 with 341 days of tracking, I exported the entire collection of movement and places data from Moves app in GeoJSON format and imported it into MongoDB. Most of the core web app functionality was built using Google Maps API and Flask. The web app itself was served using Apache on the Google Cloud Platform.
Design
- Brand & Identity
- Wireframes
- Mockups
- Prototypes
Development
- Front-end
- Back-end
- Cloud infrastructure
- Data storage

Challenges
I initially wanted the map style to reflect time of the day, but struggled with implementing it technically. Furthermore, several other challenges—from continually tracking myself to application performance—were experienced.
Constant tracking. Using the Moves app on an iPhone 7 to constantly track myself was challenging. It greatly affected the device battery so I was always carrying a charger or portable battery packs. Because of this, I had to constantly (and manually) manage location tracking.
App performance. 341 days of movement and places data were slow to load. I struggled with loading all of the data on the map at once. After trying multiple techniques, I found success in sending one request to fetch data instead of two, and by using GZIP compression on the server-side.
Future ideas
Some ideas could not make it to the initial release of this project due to technical and cost limitations, but will be worth exploring in future.
Street view timelapse. I would like to experiment with playing certain routes with a start and end point in the form of a timelapse using Google Street View. But the Google Maps API cost and restrictions may make this a challenging task.
Natural language querying. Using some of the AI and ML services as part of the Google Cloud Platform, I’d love to be able to just ask the web app where I was on a particular day and time, and have it present that information to be on the map.
Deeper photos integration. Currently, Instagram photos exist on a separate page, but it would be better to incorporate them into the map as well. This can help with telling a complete story of a particular journey.
Multi-year browsing. Long-term, I’d love to be able to browse multi-year data for movement and places visited to see how my travel patterns change over time.